5 minutes
Higher order functions over collections in Go
As a newcomer to Go with a background of functional programming, one of my first
questions was “are functions first class citizens in Go?” followed by the next question:
“are there any implementations of higher order functions over iterables
such as map, filter, or fold/reduce?” For reasons beyond the scope of
this blog post, there is no standard implementation of this pattern. However,
it’s very simple to write your own little functional toolbox:
func Map(iterable []interface{}, f func(interface{}) interface{})
    []interface{}
{
    result := make([]interface{}, len(iterable))

    for i, elem := range iterable {
        result[i] = f(iterable[i])
    }

    return result
}
This is the simplest and most generic implementation of map. With some caveats
such as lack of error handling and the fact that the compiler will reject types
such as []int or []MyStruct.
When learning about concurrency in Go, I couldn’t help by notice that a different approach can be taking to implement these functions, by leveraging the blocking features of channels, a more lazy/on demand approach can be implemented:
func Map(stream <-chan interface{}, f func(interface{}) interface{})
    <-chan interface{}
{
    result := make(chan interface{})
    go func() {
        defer close(result)

        for elem := range stream {
            result <- f(elem)
        }
    }()

    return result
}
Again, this is a very simple approach that lacks error handling and cancellation support, but it has the advantage that it won’t allocate a new arrays.
I wanted to see how different the performance for these approaches would be, so, using the benchmarking tools of Go and a self-made straightforward implementations, I compared the performance of the two approaches.
Fluid interface
I defined an interface with the declaration of the methods that are implemented, and two type aliases of channels and slices in order to be able to use fluent interfaces, a very common pattern when using this functionallity.
// pkg/enumerable/enumerable.go

// Borrowing Enumerable nomenclature from .NET 🤭
type Enumerable interface {
	Map(func(interface{}) interface{}) Enumerable
	Filter(func(interface{}) bool) Enumerable
	Fold(interface{}, func(interface{}, interface{}) interface{}) interface{}
}


// pkg/enumerable/channel.go

type ChanEnumerable <-chan interface{}


// pkg/enumerable/slice.go

type SliceEnumerable []interface{}
Now processing these enumerables becomes very declarative. An example:
numberOfUsers := userIds.
    Map(getUser).
    Filter(not(isAdmin)).
    Fold(0, sum)
Looks neat! ignoring the fact that these functions have to deal with interface{}
in their signatures, which is not the most realistic scenario
Benchmarks
I wanted to see how different these approaches would perform for increasing collection sizes, as well as number of chained calls, as the benefit of these functions is the ability to chain them as fluid interface making the code more readable and declarative.
Taking advantage of the fact that they implement the same interface, I wrote the benchmarking code to evaluate dummy functions over the incresingly sized collections:
// pkg/enumerable/test_utils.go

func benchmarkEnumerable(calls int, makeEnumerable func() Enumerable) func(*testing.B) {
	return func(b *testing.B) {
		for i := 0; i < b.N; i++ {
			enumerable := makeEnumerable()

			// .Map(..).Filter(..).Map(..).Filter(..)...
			for i := 0; i < calls; i++ {
				if isEven(i) {
					enumerable = enumerable.Map(addOne)
				} else {
					enumerable = enumerable.Filter(isEven)
				}
			}

			enumerable.Fold(0, sum)
		}
	}
}

func benchmarkEnumerables(makeEnumerable func(int) func() Enumerable, b *testing.B) {
	var (
		maxLenght  = 1000000
		lengthStep = 2
		maxCalls   = 20
		callsStep  = 2
	)

	for calls := 1; calls < maxCalls; calls = calls + callsStep {
		for length := 10; length < maxLenght; length = length * lengthStep {
			b.Run(
				fmt.Sprintf("%d,%d", length, calls),
				benchmarkEnumerable(calls, makeEnumerable(length)),
			)
		}
	}
}
Now running the benchmarks for slices and channels is as simple as:
// pkg/enumerable/channel_test.go

func BenchmarkStream(b *testing.B) { benchmarkEnumerables(makeStream, b) }


// pkg/enumerable/slice_test.go

func BenchmarkSlice(b *testing.B) { benchmarkEnumerables(makeSlice, b) }
Formatting results
Running the benchmark with the go test command does the job, but with the multiple
variables being tested the amount of results is too overwhelming to analize line
by line. The parse package
parses the output generated by the command into a struct that can be programmatically
analized. I wrote some code to simply format this as CSV using the naming convention to
include the collection length and number of calls, and write it to stdout:
// main.go

func formatBenchmark() error {
	cmd := exec.Command("go", "test", "-benchmem=true", "-bench=.", "./pkg/enumerable/.")

	output, err := cmd.Output()
	if err != nil {
		if exitErrror, ok := err.(*exec.ExitError); ok {
			return fmt.Errorf("Error: %s", string(exitErrror.Stderr))
		}

		return err
	}

	benchmarkSet, err := parse.ParseSet(bytes.NewReader(output))
	if err != nil {
		return err
	}

	writer := csv.NewWriter(os.Stdout)
	defer writer.Flush()

	writer.Write([]string{
		"name",
		"size",
		"ncalls",
		"nsperop",
		"n",
		"bperop",
		"allocs",
	})

	for name, benchmarks := range benchmarkSet {
		for _, benchmark := range benchmarks {
			bmData := parseName(name)

			writer.Write([]string{
				bmData.name,
				fmt.Sprintf("%d", bmData.size),
				fmt.Sprintf("%d", bmData.calls),
				fmt.Sprintf("%.6f", benchmark.NsPerOp),
				fmt.Sprintf("%d", benchmark.N),
				fmt.Sprintf("%d", benchmark.AllocedBytesPerOp),
				fmt.Sprintf("%d", benchmark.AllocsPerOp),
			})
		}
	}

	return nil
}
Plotting
I decided to use R to plot the results because of the straightforward yet extremely
powerful approach of ggplot2. In only 20 lines I was able to generate beautiful
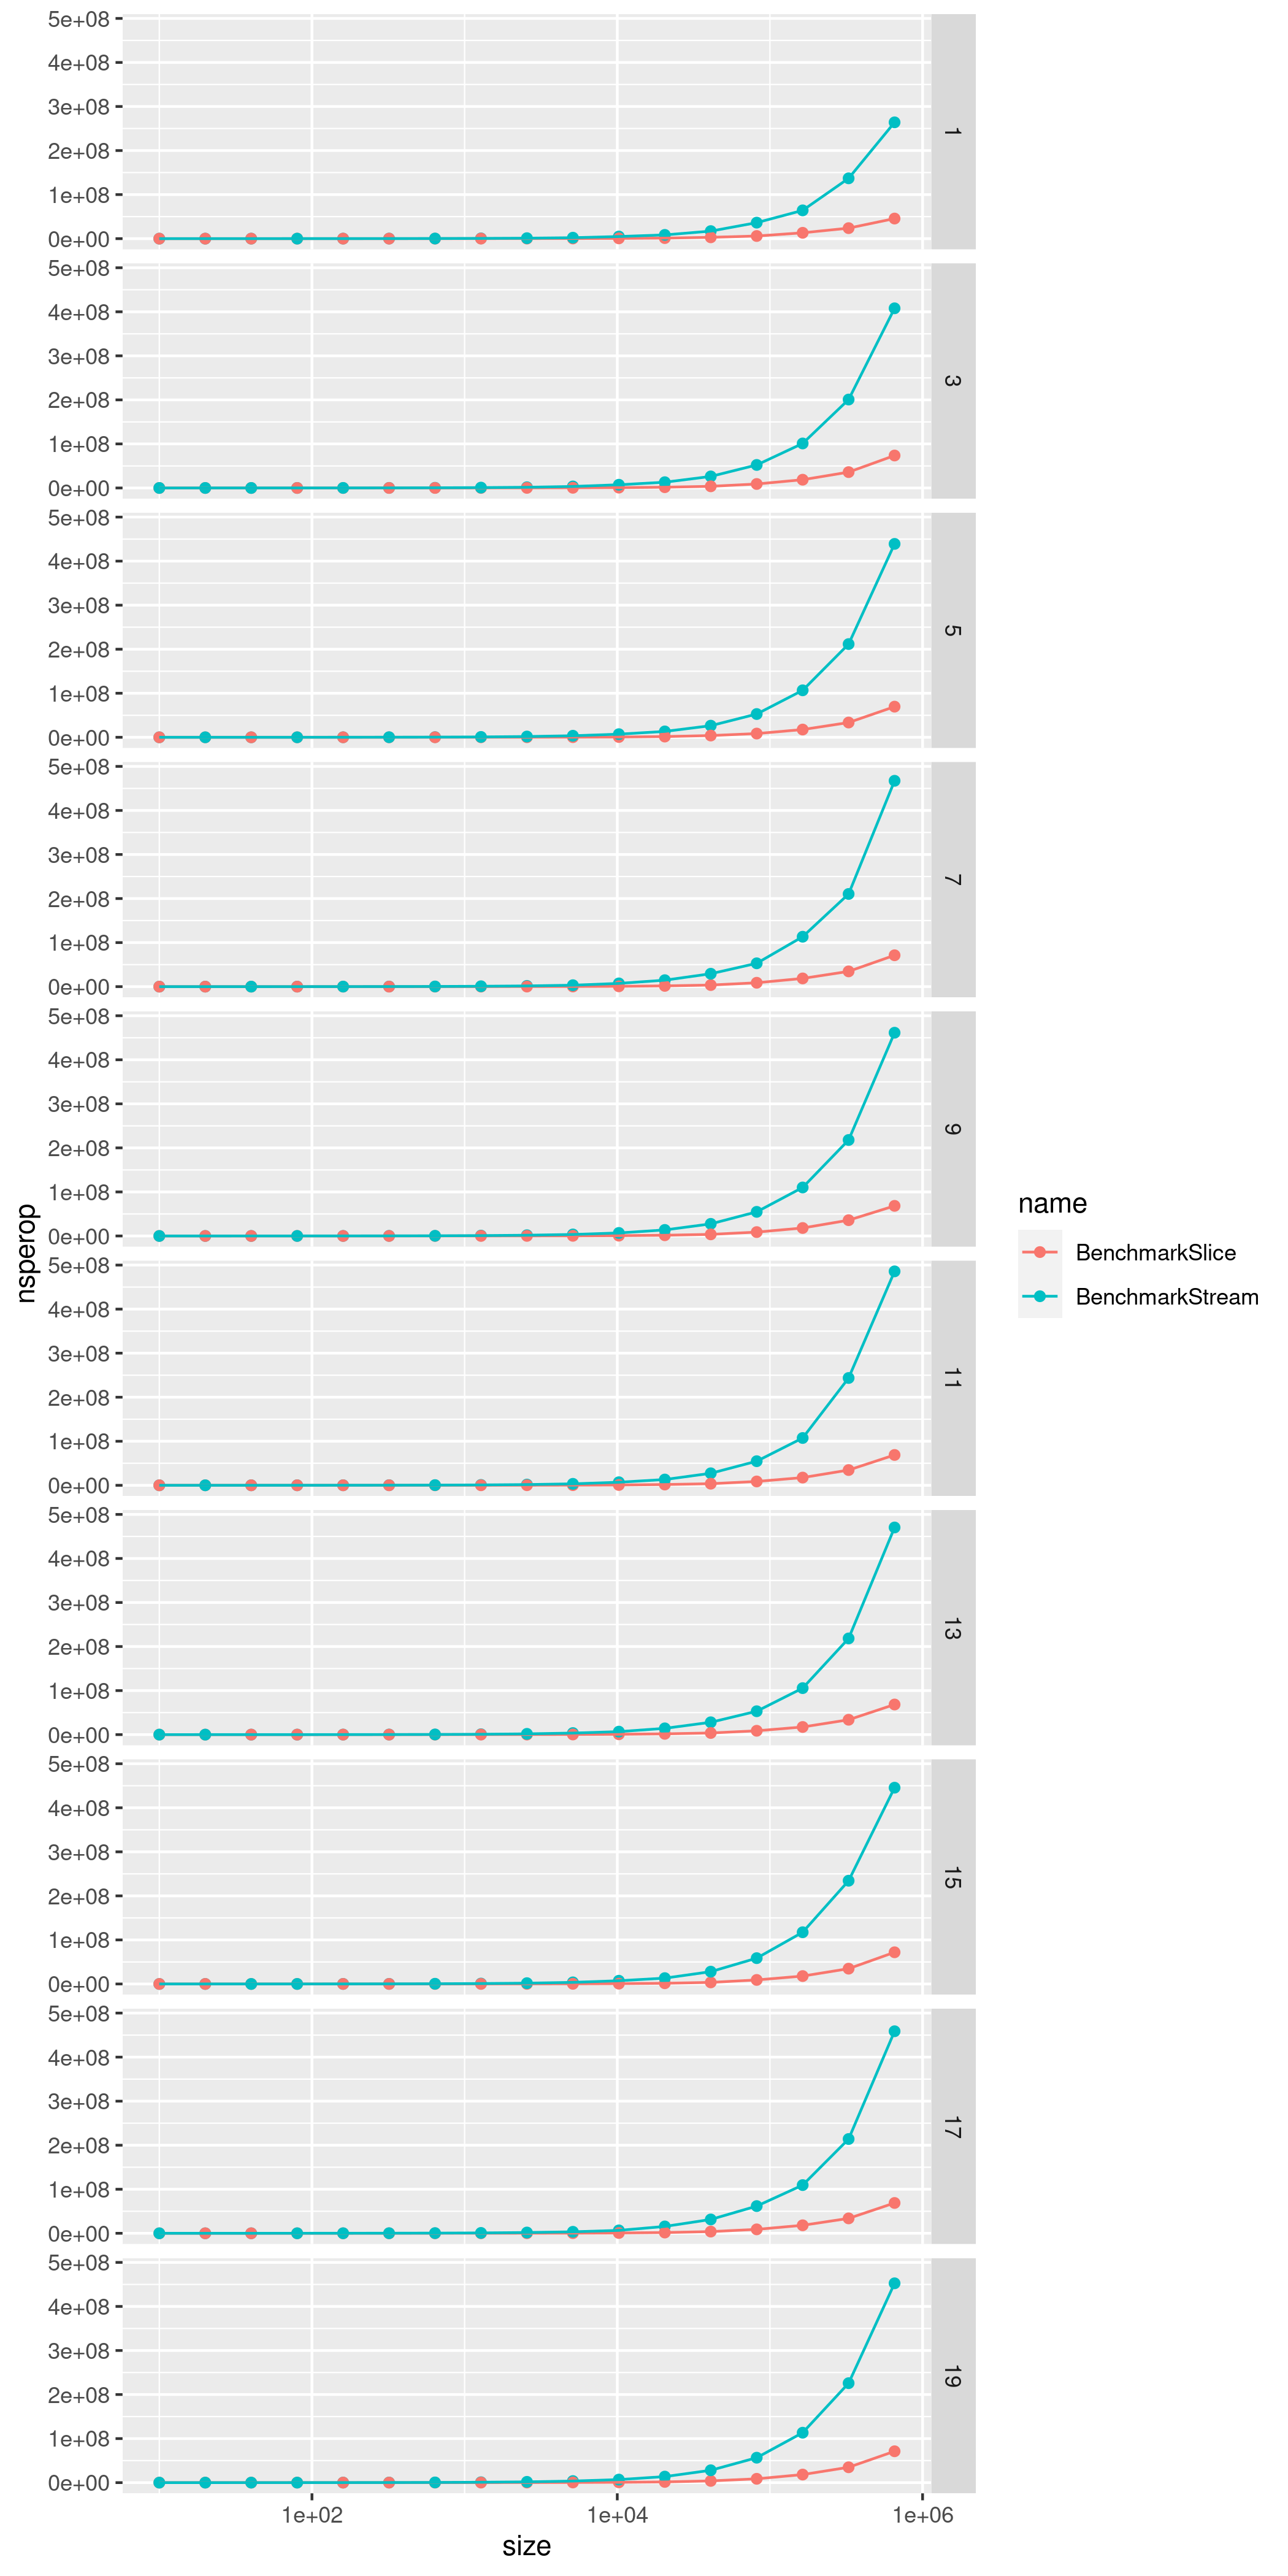
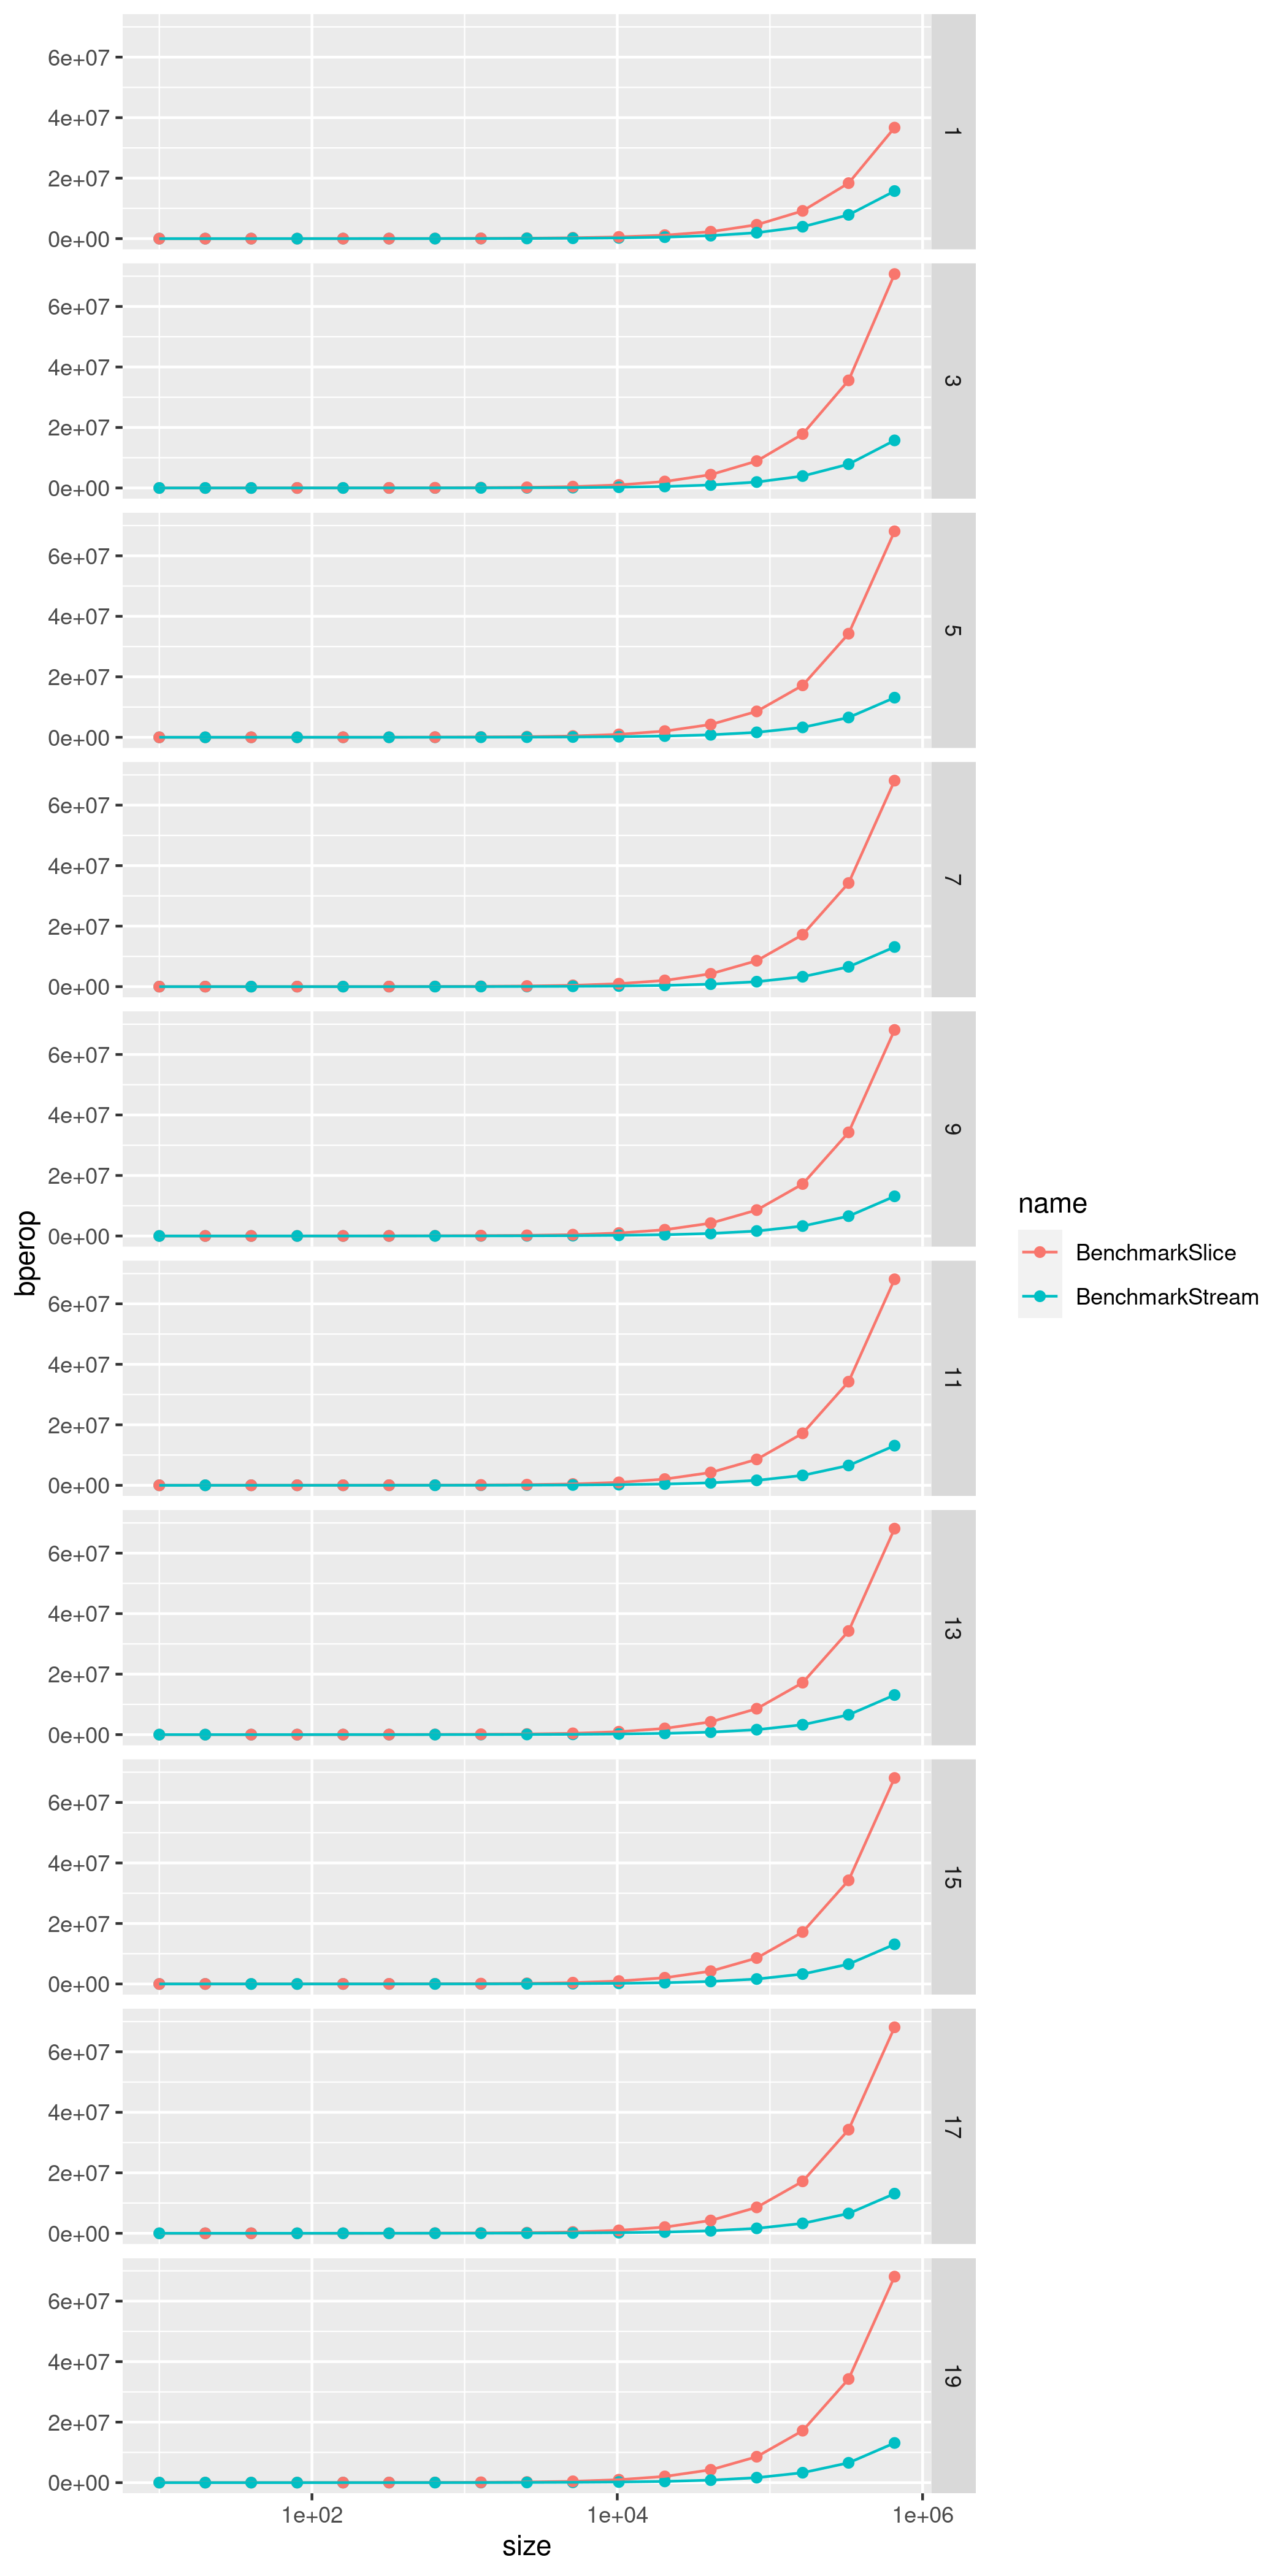
charts describing the increase of time per operation and memory allocated per operation,
comparing the two implementations of Enumerable
bench_results <- read_csv("result.csv")

plot_nsperop <- ggplot(bench_results, aes(size, nsperop, colour = name)) +
    geom_point() +
    geom_line() +
    scale_x_log10() +
    facet_grid(rows = vars(ncalls))

ggsave("plot_nsperop.png", width = 7, height = 14)

plot_bperop <- ggplot(bench_results, aes(size, bperop, colour = name)) +
    geom_point() +
    geom_line() +
    scale_x_log10() +
    facet_grid(rows = vars(ncalls))

ggsave("plot_bperop.png", width = 7, height = 14
The results:
Conclusion
As easily seen in the plots, nothing unexpected has been found. The performance for the slice-based approach is significantly better regardless of the number of chained calls; spawning and blocking goroutines isn’t cost-free. We can see however that, when it comes to memory allocation, the channel-based approach uses less resources than the slice-based one, as no extra memory is allocated: Each element is processed on-demand until the channel is closed.
Most importantly, when performance tuning isn’t critical, is the advantage of having
a declarative, implementation-agnostic API such as (in this example) the Enumerable
interface, allowing clients to process data with interchangeable underlying implementations.
The repo with the code using for this benchmark can be found on GitHub. Feel free to clone it and play around with it!